Overall Results
Between 2015 and 2016 the live performance industry in each state and territory experienced varying shifts in growth and decline in both ticket sales revenue and attendance. The variation in growth and decline generated in each market is primarily impacted by major tours or events, particularly international tours that take place in each state or territory in any given year.
- NSW and Victoria generate the largest share of revenue and attendance. Additionally, both states generate a larger share of industry revenue and attendance compared to their share of Australia’s population.
- Both NSW and Tasmania experienced steady growth in both revenue and attendance.
- Victoria remained steady, recording slight growth in revenue despite a slight decline in attendance.
- Queensland, ACT and NT all experienced declines in revenue and attendance.
- Both WA and SA experienced declines in revenue, despite generating steady growth in attendance.
NSW experienced an increase in revenue by 10.9% (to $530.2m) and attendance by 8.6% (to 6.1m) between 2015 and 2016. This increase in revenue and attendance was largely driven by growth in the following categories:
- Circus and Physical Theatre experienced an increase of 140% in revenue and 122.1% in attendance primarily attributable to Cirque du Soleil’s tours of QUIDAM and KOOZA to NSW.
- Comedy revenue and attendance increased by 82.4% and 115.7% respectively, driven by the tours of high-profile international comedians including Kevin Hart, Michael McIntyre and Dawn French.
- Classical Music experienced an increase of 42.7% in revenue and 29.8% in attendance primarily due to the return of André Rieu for the first time since 2013.
- Musical Theatre revenue increased by 15.5% and attendance by 5.4% due to performances of major musicals taking place including My Fair Lady, The Sound of Music and Aladdin.
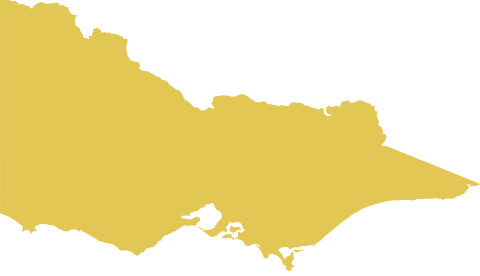
Victoria experienced a slight increase in revenue by 0.8% (to $440.3m) and a slight decrease in attendance of 2.1% (to 5.4m) between 2015 and 2016. The slight increase in revenue was driven by significant increases in Opera (53.6%) and Special Events (340.2%), offset by substantial decreases in Festivals (Multi-category) (44.2%) and Circus and Physical Theatre (67.5%).
- Opera revenue increased primarily due to the return of Opera Australia’s production of The Ring Cycle performed exclusively in Melbourne. This production was previously performed in Melbourne in 2013. The increase of revenue in Special Events was primarily due to the Royal Edinburgh Military Tattoo performing in Melbourne for the first time.
- Festivals (Multi-Category) revenue decreased due to falling ticket prices across the festivals held in Victoria. The decrease in revenue for Circus and Physical Theatre can be primarily attributed to the absence of Cirque du Soleil, which performed in Victoria in 2015 but did not return in 2016.
WA revenue decreased by 12.4% (to $147.8m) despite a 5% rise in attendance between 2015 and 2016. The decline in revenue was largely driven by decreases in the following categories:
- Circus and Physical Theatre revenue decreased by 73.2% due primarily to the absence of Cirque du Soleil, which performed in WA in 2015 but did not return in 2016.
- Festivals (Contemporary Music) decreased by 52%, with the WA festivals market being hit particularly hard by the cancellation of Future Music Festival and Stereosonic in 2016.
- Contemporary Music revenue decreased by 34.5% due to a number of prominent acts that attracted large crowds in 2015 not returning in 2016, such as AC/DC, Fleetwood Mac, Foo Fighters, Ed Sheeran and One Direction. Additionally, many of the high-profile international acts that toured Australia in 2016 did not perform in WA including Coldplay, Prince, Selena Gomez, Kendrick Lamar and Madonna.
Despite the fall in revenue, attendance at live performance events in WA increased due to significant attendance growth in a number of categories.
- Children’s/Family Events and Comedy attendance in WA increased by 169.8% and 216.9% respectively due to the impact of major tours, particularly international tours that took place across both categories. In Children’s/Family Events this included tours by Disney on Ice: Magical Ice Festival and The Wiggles. In Comedy this included tours by international comedians including Billy Crystal and Dawn French.
- Musical Theatre attendance increased by 63.6% primarily due to performances of major musicals in Perth including The Lion King, The Sound of Music and Little Shop of Horrors.
Queensland experienced a decline in revenue by 7.7% (to $180.3m) and attendance by 13.3% (2.5m) between 2015 and 2016. The declines in revenue and attendance were largely driven by decreases in the following categories:
- Musical Theatre revenue and attendance declined by 30% due to a decrease in the number of major musicals performing in 2016 compared to 2015.
- Festivals (Multi-Category) revenue declined by 25% and attendance by 17.6% primarily due to falling ticket prices across festivals held in Queensland.
SA experienced a slight decline in revenue of 2.6% (to $94.3m), despite attendance increasing by 5.7% (to 1.8m) between 2015 and 2016. The fall in revenue was primarily driven by significant declines in revenue in the following:
- Circus and Physical Theatre revenue decreased by 75.4% due primarily to the absence of Cirque du Soleil, which performed in SA in 2015 but did not return in 2016.
- Festivals (Contemporary Music) experienced a decrease in revenue by 74.6%, due to the SA festivals market being hit particularly hard by the cancellation of major national touring festivals Future Music Festival and Stereosonic in 2016.
- Contemporary Music revenue decreased by 20% primarily due to a number of prominent acts that attracted large crowds in 2015 not returning in 2016. Additionally many of the high-profile international acts that toured Australia in 2016 did not perform in SA including Coldplay, Prince, Selena Gomez, Kendrick Lamar and Madonna.
The increase in attendance at live performance events in SA between 2015 and 2016 was largely driven by increased attendance in a number of categories.
- Classical Music attendance increased by 78% due both to an increase in attendance to performances by AMPAG companies including Adelaide Symphony Orchestra, as well as the return of international artist André Rieu for the first time since 2013.
- Musical Theatre attendance increased by 74.6% due to the performance of major musicals including CATS, Ghost the Musical, Singin’ in the Rain, Little Shop of Horrors and The Sound of Music.
- Attendance at Children’s/Family Events increased by 39.7%, due to high-profile major performances including Disney on Ice: Magical Ice Festival, Scooby-Doo Live and performances by The Wiggles.
ACT experienced the greatest decline in revenue and attendance amongst all the states and territories. Between 2015 and 2016 revenue decreased by 16.8% (to $19.6m) and attendance decreased by 15.9% (to 0.31m). This decline in growth was primarily due to the absence of Cirque du Soleil, which performed in Canberra in 2015 but did not return in 2016.
Tasmania experienced the highest growth in revenue and attendance amongst all the states and territories. Between 2015 and 2016 revenue increased by 38.5% (to $14.7m) and attendance increased by 13.7% (to 0.24m). This significant growth was primarily due to Cirque du Soleil’s performances of QUIDAM in Hobart. Cirque du Soleil last performed in Tasmania in 2011.
NT experienced a slight decline in revenue by 2.3% (to $3.1m) and in attendance by 6.8% (to 65k).
 New South Wales
 Victoria
 Queensland
 Western Australia
 South Australia
 Australian Capital Territory
 Tasmania
 Northern Territory