LPA Ticket Attendance and Revenue Survey 2015

Photo: Lore - Bangarra Dance Theatre, Jeff Tan

Revenue and Attendance by State

Overall Results

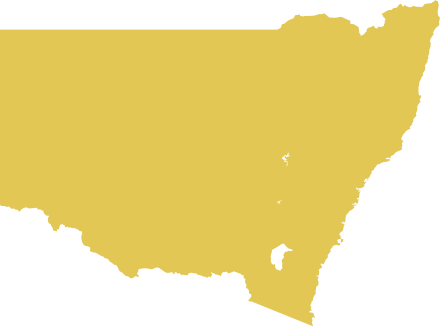
Between 2014 and 2015, New South Wales experienced a decline in terms of revenue (12.6%) and attendance (8.8%). This decline was largely driven by a fall in revenue in the following genres:

  • Circus and Physical Theatre category, with revenue declining by 46% and attendance by 45%. This can be attributed to Cirque du Soleil’s season of TOTEM opening in Sydney in October 2014 and closing in January 2015.
  • Contemporary Music category, with revenue declining by 21% and attendance by 17% between 2014 and 2015.
  • Festivals (Multi-Category), with revenue declining by 30% and attendance by 15%.

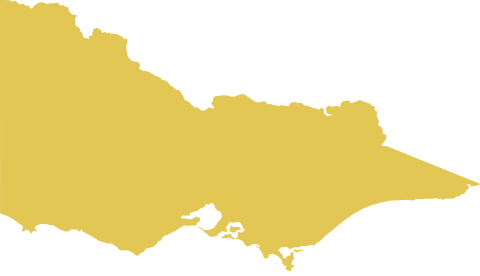
Victoria experienced a slight decline in terms of revenue (2.9%) between 2014 and 2015, despite a slight increase in attendance (4.3%). This decline was largely driven by a fall in revenue in the following genres:

  • Theatre category, with revenue declining by 47% between 2014 and 2015.
  • Contemporary Music category, with revenue declining by 24%.
  • Festivals (Single-Category), with revenue declining by 45%.

The fall in revenue was partially offset by strong growth in the Circus and Physical Theatre category, which improved in 2015 as a direct consequence of Cirque du Soleil performances returning to Victoria for the first time since 2013. Despite the decline in total revenue, attendance at live performance events in Victoria rose due to high attendance growth in the Ballet and Dance, Circus and Physical Theatre, Special Events and Festivals (Multi-Category) categories. Overall, New South Wales and Victoria had combined revenue of $915.01 million and continued to account for approximately two-thirds of the entire Australian Live Performance Industry.

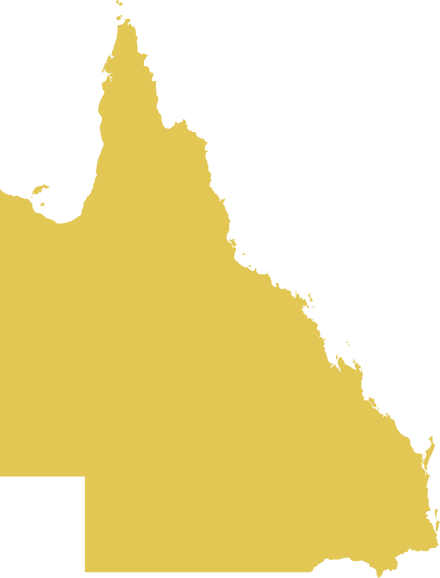
Queensland suffered a decline in revenue of 4.2% between 2014 and 2015. This decline was largely driven by a fall in revenue in the following genres:

  • Ballet and Dance category, with revenue declining by 39% between 2014 and 2015. The decline may be partially due to the fact that the American Ballet Theatre, which performed a season of Swan Lake and Three Masterpieces in Brisbane in 2014, did not return in 2015.
  • Theatre category, with revenue declining by 66% and attendance by 42% due predominately to a decline in the number of commercial productions staged in Brisbane.

Despite a fall in revenue, attendance at live performance events in Queensland rose due to high attendance growth in the Festivals (Multi-Category), Musical Theatre, Special Events and Circus and Physical Theatre categories.

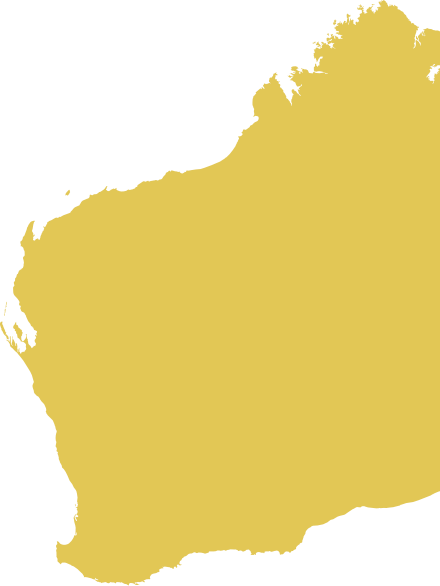
Western Australia experienced a significant decline in revenue (8.4%) and attendance (13.1%) due primarily to falls in the:

  • Children’s/Family category, with revenue declining by 58% and attendance by 54% between 2014 and 2015.
  • Theatre category, with revenue declining by 80% and attendance by 67%.

This report does not include 248,274 tickets and $6,194,244 in sales revenue generated by the Fringe World Festival (Perth) in 2015. On a like for like basis including Fringe World Festival, Western Australia experienced a decline in revenue and attendance of 4.9% and 2.1% respectively.

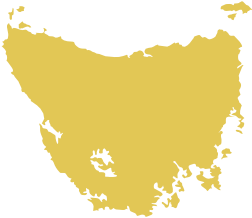
Across the other States and Territories, results were mixed. ACT experienced significant revenue growth (69.7%) due predominately to the return of Cirque du Soleil with performances of QUIDAM. Tasmania and South Australia experienced declining revenue despite attendance growth. Despite a significant decline in attendance of 37%, revenue growth in the Northern Territory remained steady due to revenue growth in the Comedy, Circus and Physical Theatre and Contemporary Music categories.

It is to be noted that due to confidentiality requirements, revenue and attendance by state results have not been provided for Australia Council for the Arts (Key Organisations) & Australian Performing Arts Centres Association (APACA) members (“Supplementary data”). As such the following sub-sections on our state analysis only refer to the Ticketing Survey data and not the Supplementary data.
Close Table

Total Revenue and Attendances by State/Territory (2014-15)

State/Territory Revenue Share of Industry (2015) Share of Industry (2014) Change in Revenue from 2014 Tickets Share of Industry (2015) Share of Industry (2014) Change in Attendance from 2014
New South Wales $550,305,404 39.7% 36.3% 0.6% 6,732,697 37.1% 33.1% 9.8%
Victoria $415,464,484 30.0% 29.8% -7.7% 5,341,923 29.4% 28.7% 0.4%
Queensland $140,649,408 10.2% 13.5% -31.0% 2,339,394 12.9% 14.4% -12.1%
Western Australia $162,494,027 11.7% 11.8% -8.4% 1,969,668 10.8% 12.2% -13.1%
South Australia $79,264,308 5.7% 6.7% -21.5% 1,134,654 6.2% 8.7% -29.7%
Australian Capital Territory $23,506,143 1.7% 0.9% 69.7% 372,546 2.1% 1.3% 51.1%
Tasmania $10,641,913 0.8% 0.8% -8.3% 210,798 1.2% 1.0% 13.9%
Northern Territory $3,219,331 0.2% 0.2% 3.4% 70,014 0.4% 0.6% -37.0%
Total $1,385,545,019 100.0% 100.0% -8.1% 18,171,694 100.0% 100.0% -2.0%

Percentage Movement by State

Note: This report does not include 248,274 tickets and $6,194,244 in sales revenue generated by the Fringe World Festival (Perth) in 2015. On a like for like basis including Fringe World Festival, Western Australia experienced a decline in revenue and attendance of 4.9% and 2.1% respectively.

Photo: Samson - Belvoir, Lisa Tomasetti

Population and Per Capita Results Click for more info

Share of population is shown by bubble size

Note: This report does not include 248,274 tickets and $6,194,244 in sales revenue generated by the Fringe World Festival (Perth) in 2015. On a like for like basis including Fringe World Festival, Western Australia experienced a decline in revenue and attendance of 4.9% and 2.1% respectively.

A comparison of each state and territory's share of the Live Performance Industry against their population provides insight into spend per capita, as well as the concentration of the industry relative to where people live. New South Wales and Victoria command a larger share of revenue compared to their share of Australia's population. Victoria's revenue and attendance was above its share of the population and had the highest spend per capita in 2014 and 2015.

Queensland had a significantly lower proportion of industry revenue and attendance compared to its share of population and consequently a significantly lower spend per capita ($40.62) compared to the national average ($58.78). There exist several reasons for these disproportional results:

  • Some of Australia's largest performing arts companies are based in New South Wales and Victoria and as such stage the bulk of their performances in Sydney and Melbourne, for example Opera Australia (Sydney), Melbourne Symphony Orchestra, Sydney Symphony Orchestra and The Australian Ballet (Melbourne).
  • Destination NSW and Visit Victoria (formerly Victorian Major Events Company) are particularly active in the live performance major events market and as such have been successful in attracting major live performance events to these states. The majority of regional performances are not included in this per capita analysis and as such, performances in larger states with significant regional markets, such as Queensland, are under-reported. Some of these events have been captured in the data provided by Australia Council for the Arts (Key Organisations) & Australian Performing Arts Centres Association (APACA) members.
  • Cities such as Brisbane are constrained in their ability to host performances due to a smaller number of venues and hence capacity, compared to Melbourne for example. South Australia's larger share of attendance can partly be explained by the inclusion of Adelaide Fringe data. This festival attracted high attendance to numerous low cost events.

It should be noted that these state and territory breakdowns do not take into account people who travel from interstate or overseas to watch a live performance. Industry share only accounts for the state or territory in which the performance took place and hence where the revenue and attendance are recognised. This is particularly relevant for categories such as Musical Theatre where musicals opening their season in a particular state often attract significant visitation from outside that state.

Due to confidentiality requirements, per capita results have not been provided for Australia Council for the Arts (Key Organisations) & Australian Performing Arts Centres Association (APACA) members.

Close Table

Population and Per Capita Results (2015)

State/Territory Population (2015) (m) Share of Population Share of Industry Revenue  Share of Industry Attendance Spend per Capita
New South Wales 7.67 32.0% 34.0% 30.4% $62.33
Victoria 6.00 25.1% 31.1% 30.2% $72.87
Queensland 4.81 20.1% 13.9% 15.9% $40.62
Western Australia 2.60 10.9% 11.5% 10.7% $62.40
South Australia 1.70 7.1% 6.9% 9.2% $56.85
Australian Capital Territory 0.39 1.6% 1.7% 2.0% $45.43
Tasmania 0.52 2.2% 0.8% 1.1% $43.61
Northern Territory 0.24 1.0% 0.2% 0.4% $8.19
Total 23.94 100.0% 100.0% 100.0% $58.78

*Source: ABS - Australian Demographic Statistics, Dec 2015

Photo: ACO Underground 2015 - Australian Chamber Orchestra, Prudence Upton

Individual State Results

New South Wales

NSW infographic (PDF)

State Trends

Category Share

Photo: Storm Boy - Barking Gecko Theatre Company and Sydney Theatre Company, Jon Green

State Trends

Category Share

Photo: But Wait... There's More - Circus Oz, Rob Blackburn

State Trends

Category Share

Photo: The Sleeping Beauty - Queensland Ballet, David Kelly

Western Australia

WA infographic (PDF)

State Trends

Category Share

Note: This report does not include 248,274 tickets and $6,194,244 in sales revenue generated by the Fringe World Festival (Perth) in 2015. On a like for like basis including Fringe World Festival, Western Australia experienced a decline in revenue and attendance of 4.9% and 2.1% respectively.

Photo: Blithe Spirit - Black Swan Theatre Company, Gary Marsh

South Australia

SA infographic (PDF)

State Trends

Category Share

Photo: Summer of the Seventeenth Doll - State Theatre Company of South Australia, Shane Reid

Australian Capital Territory

ACT infographic (PDF)

State Trends

Category Share

Category Share ACT/TAS/NT (combined for confidentiality purposes)

Photo: As You Like It - Bell Shakespeare, Rush Photography

State Trends

Category Share

Category Share ACT/TAS/NT (combined for confidentiality purposes)

Photo: Red Racing Hood - Terrapin Puppet Theatre, Peter Mathew

Northern Territory

NT infographic (PDF)

State Trends

Category Share

Category Share ACT/TAS/NT (combined for confidentiality purposes)

Photo: Broken - Brown's Mart Theatre, Glenn Campbell